
Commentaries
Factor Insights - Q1 2023
Factor Insights – Value Rides Again
The underperformance of value relative to the pedestal-worthy showing of growth over the last decade or so is the worst kept secret in finance. There is no shortage of theories for this spectacle – better structural changes in the management of growth companies, crowding by hordes of investors that has reduced the value premium, outright death of the factor altogether.
But a cautious murmur started among the gun-shy disciples of the value discipline at the end of 2020, when value stocks started to ever-so-slightly pull ahead of growth. 2021 was a good year too, and value bested growth to outpace the broad market. But momentum is a real thing and we’ve been here before. Growth’s dominance has been hard to break, particularly in an environment of cheap money and economic expansion. Value’s false starts over the last decade saw it intermittently pull a step ahead only to fall two (or more) behind, so wariness from the value camp is not unwarranted. However, 2022 was another consecutive year of impressive performance, perhaps relished by secretly giddy value investors since it blew growth out of the water by over 25%. There is some historical evidence that levels of many current economic indicators may be been a boon for the value factor, so can we expect value to keep its seat this time?
Bucking the Trend
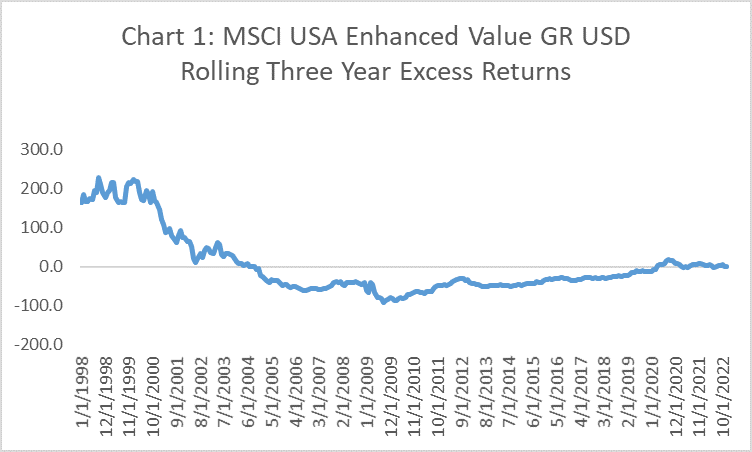
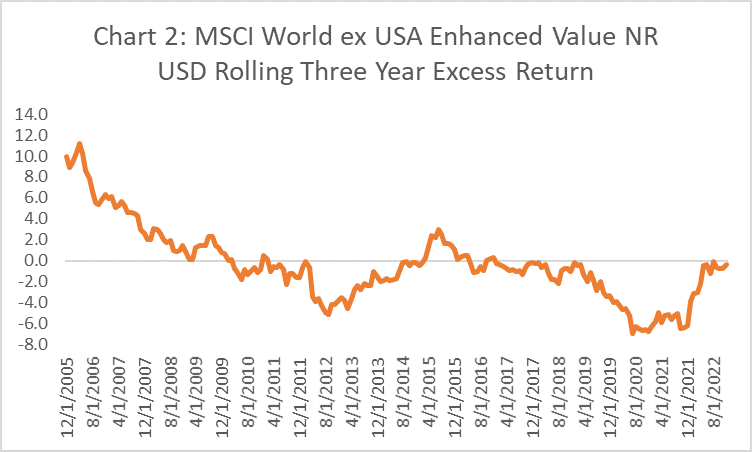
Without question, value has disappointed over the last five years, and potentially longer depending on your preferred definition of the factor. Table 1 shows the excess return of the long-only MSCI Enhanced Value index relative to the MSCI USA index, as well as the MSCI ex-USA Enhanced Value index vs the MSCI ex USA index. Value investors were left behind the world over in the trailing three-, five-, ten- and fifteen-year period.
Table 1: Excess return to the value factor has been negative for an extended period
| 3 Years | 5 Years | 10 Years | 15 Years | 20 Years | |
|---|---|---|---|---|---|
| Excess Return of MSCI USA Enhanced Value GR USD | -3.97 | -4.60 | -1.56 | -0.82 | 0.30 |
| Excess Return of MSCI World ex USA Enhanced Value NR USD | -0.38 | -1.79 | -0.78 | -1.10 | 0.72 |
Rolling returns paint a similar story over intermediate periods. Both domestic and ex-US value indices struggled to outpace their broad market proxies over rolling three-year periods since their respective inceptions until recently, as shown in the charts below. Value’s turnabout began in 2020, with a more dramatic about-face in markets outside the US.
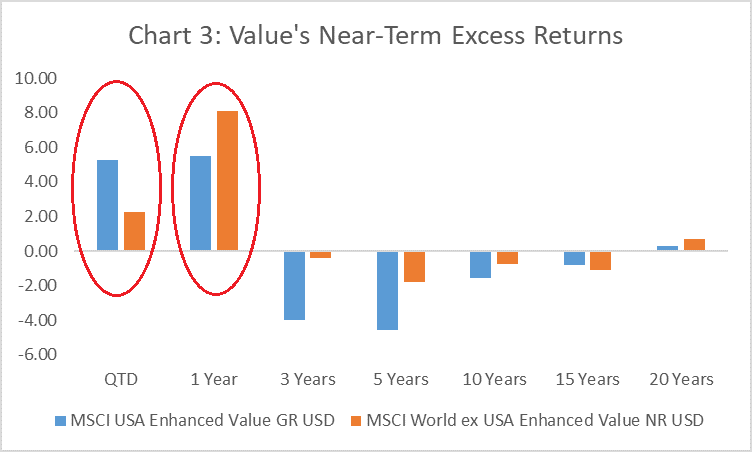
The trend is crystallized in Chart 3. Trailing excess return of the value indices have finally bucked the intermediate trend over the last year, handily outpacing broad market indices here and abroad over the one-year period ending December 31, 2022. The market environment appears to be giving the factor a leg up, and a continuation of several trends could further propel the outperformance of value.
Trend 1: Increasing Interest Rates
It’s difficult to talk about the explosive expansion in valuations for growth companies without acknowledging the role of the historically low interest rate environment that existed from the Global Financial Crisis (“GFC”) up until this year. The classic argument for the outperformance of growth when rates are low is that under a simple discounted cash flow valuation, future cash flows from growth (the numerator) are worth more today when rates (the denominator) are low. When rates go up, those cash flows are discounted at a higher rate, and worth less today. Conversely, the argument goes, value stocks tend to be more mature companies with stable earnings and less borrowing. As a result, they earn a return from slower growing revenues that are near-term, or shorter duration, than their growth counterparts, and therefore the discounting effect of rising rates has less of an impact on their performance.
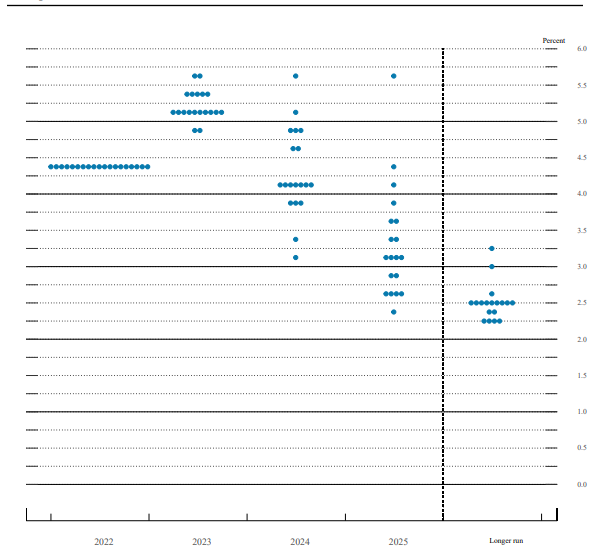
The jury is still out on whether this is a concrete effect. Rising rates tend to compress multiples, with growth suffering more than value. There is some evidence that value outperforms growth when yields have risen by more than two standard deviations of their historic average, but less evidence of this when rates are small and gradual. Certainly, we find ourselves in the former space, as 10-year rates have risen by more than 200 basis points throughout the course of 2022 and the Federal Funds Rate stands at 4.33% as of this writing. As seen in Figure 1 below, estimates from the FOMC are that rates may continue to climb in 2023 before falling in 2024 and beyond.
Figure 1: The FOMC expects a higher fed funds rate, which may boost value stocks.
Trend 2: Heightened Inflation
Another remnant of the GFC was stubbornly low inflation. Mediocre economic growth post-GFC kept inflation at historically low levels. However, post-COVID supply chain issues, increasing consumer demand fueled partly by government stimulus, and the war in Ukraine have coalesced to push inflation to heights not seen in decades (Figure 2).
Figure 2: 12-month inflation growth rate is running hot.
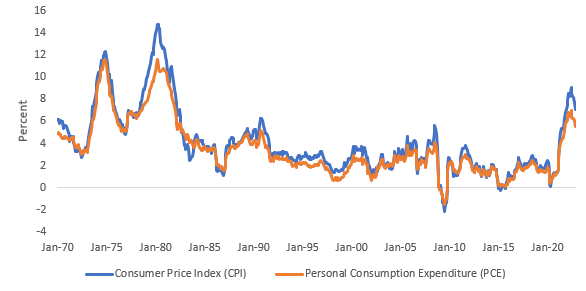
The evidence for how inflation affects value stocks is somewhat mixed. Anecdotally, more established value companies may be better able to weather rising inflation through their ability to pass on price increases more easily to their consumers. These stocks tend to offer exposure to cyclical sectors that benefit from an increase in inflation, but those sector exposures have changed over time and may wane in the future. Additionally, while higher inflation may help value on a relative basis compared to growth, continued excessive inflation will likely be felt in revenues across sectors and styles.
Trend 3: Unprecedented Valuation Spreads
Since the historical experience of value stocks in differing interest rate and inflation regimes is not incredibly robust, the most convincing argument for a sustained value rotation may be in the spread between value and growth valuations. Arnott, Harvey, Kalesnik and Linnainmaa (2021) find evidence to suggest the underperformance of value stocks has been greatly impacted by the overperformance of growth stocks.
Growth stocks have appreciated rapidly with the help of ultra-low rates instituted by central banks after the fallout from the GFC. These low rates made future growth potential much more attractive on a discounted cash flow basis, as noted above. In addition, investors hungry for a return they couldn’t find in safer assets flocked to the growth companies that were forecasting earnings expansion, and indiscriminate buying of growth-oriented stocks drove their prices ever higher. In many cases, future earnings growth expectations became divorced from reality (see Peloton and Zoom Communications), but the unwinding of these excessive valuations is likely underway. On the other hand, many value sectors like financials and energy initially saw earnings fall dramatically and were shunned. As growth stocks got more expensive, they lifted overall equity markets, and value stocks appeared to be ever cheaper.
The authors looked at relative valuations, defined as the ratio of B/P for a portfolio of growth stocks relative to the B/P for a portfolio of value stocks, from July 1963 to June 2020. The median historical ratio was 0.21, with growth stocks on average about 4.8 times more expensive than value stocks. The authors noted that over the period from December 2006 through June 2020, value experienced its worst drawdown against growth, and relative valuations for value versus growth moved from the 25th percentile to the most extreme 100th percentile.
Figure 4: Relative valuations for value to growth are at historic extremes
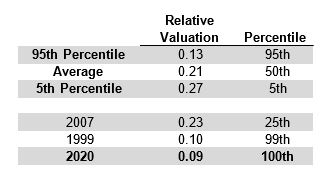
Other researchers such as AQR1 and J.P. Morgan2 have found similar valuation extremes for value relative to growth, and our own QRG Capital Management team forecasts high returns to the value factor based on current valuation spreads as well. Although relative valuations for value have improved recently, their placement at such extremes suggests that the tendency for mean reversion alone is a massive propellent for value to outperform.
Ready to Ride
Without a doubt, we have seen this play out before. Value has had some ups among the many downs over the last decade or so, but none of them were sustainable in a landscape that vastly favored growth. A shifting interest rate regime, higher absolute inflation, and most importantly extreme relative valuations may be just the catalysts to get value back in the saddle for good.
1See Asness, Cliff. Value Spreads are Back to Tech Bubble Highs: Is Everyone Out There Cray-Cray?. August 5, 2022. https://www.aqr.com/Insights/Perspectives/Value-Spreads-Back-to-Tech-Bubble-Highs-Are-You-People-Crazy
2See Butler, Ian and Joyce Weng. Value vs. Growth investing: Value returns with a vengeance. March 2022. https://am.jpmorgan.com/hu/en/asset-management/institutional/insights/portfolio-insights/value-vs-growth-investing/
Sources:
Robert D. Arnott, Campbell R. Harvey, Vitali Kalesnik & Juhani T. Linnainmaa (2021) Reports of Value’s Death May Be Greatly Exaggerated, Financial Analysts Journal, 77:1, 44-67, DOI: 10.1080/0015198X.2020.1842704
Past performance is not indicative of future results. The information, analysis and opinions expressed herein are for informational purposes only and do not necessarily reflect the views of Envestnet. These views reflect the judgment of the author as of the date of writing and are subject to change at any time without notice. Nothing contained in this piece is intended to constitute legal, tax, accounting, securities, or investment advice, nor an opinion regarding the appropriateness of any investment, nor a solicitation of any type.