
Commentaries
Inflationary effects on factor premia
Investors are facing a host of regime-shifting dynamics as 2022 gets off to a rocky start. The effects of the government’s response to the fluid pandemic situation are being compounded by the accruing economic fallout from Russia’s invasion of Ukraine to paint an inflation picture not seen for nearly four decades. Factor premia are not insusceptible to the effects of inflation, and some will likely fair better than others.
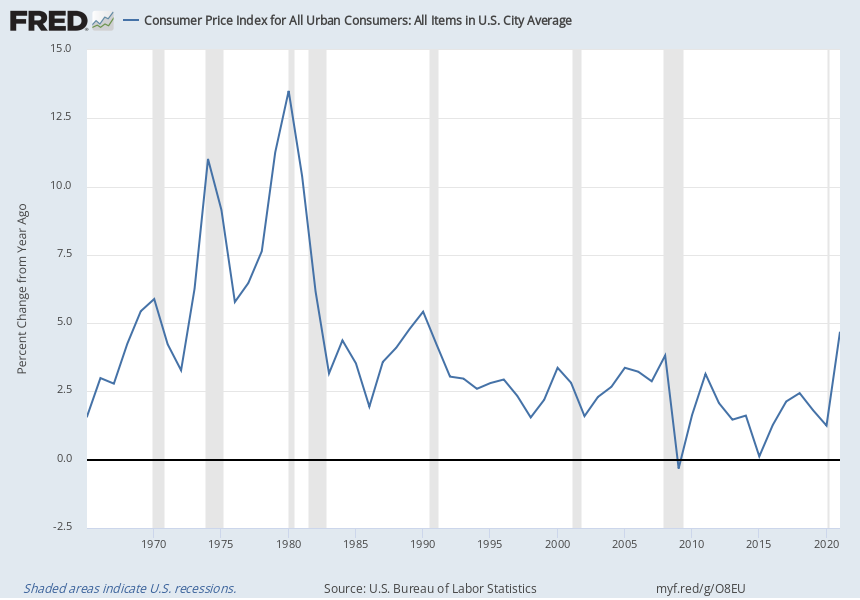
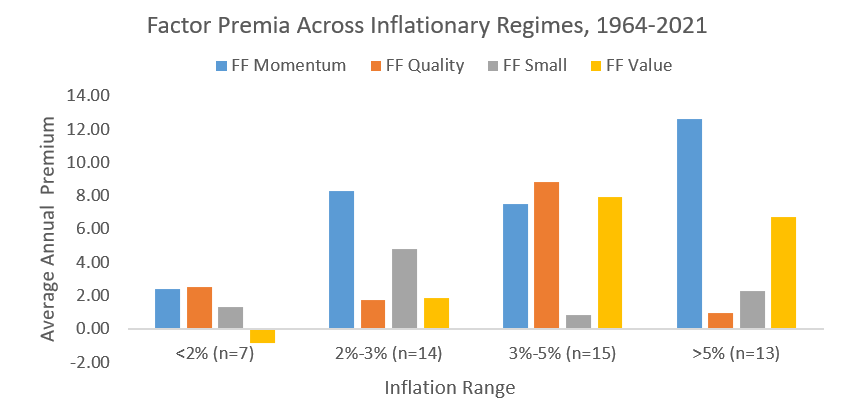
The chart below shows the average calendar year premia for various Fama French factors1 from 1964 through 2021. Calendar year premia were bucketed according to the annual inflation rate as reported by the Federal Reserve2 using CPI for all urban consumers, and the average annual premium for each factor is shown in each inflationary environment. Most annual inflation observations were seen in the three to five percent range and reported annual inflation over this timeframe was between -0.4 percent (2009) and 13.5 percent (1980).
Momentum has been the most resilient factor over the entirety of this timeframe and performed particularly well in periods of inflation above five percent. This may stem from the feedback loop effect of higher inflation forcing higher wages, in turn begetting increased demand, in turn spurring earnings growth and increasing asset prices - rinse and repeat. Quality and small cap premia have also been positive across these varying inflation environments. Quality is likely buoyed across environments by sustained interest from institutional investors who tend to favor the fundamentally strong equities that align with this factor.
|
Average GDP Growth YOY % |
2.27 (-3.4 - 6.50) |
3.28 (1 - 6.60) |
3.66 (-0.10 – 7.20) |
2.25 (-1.80 – 5.60) |
|
Average Fed Funds Rate % |
1.92 (0.09 - 6.81) |
3.50 (0.14 - 5.84) |
5.49 (0.08 - 10.23) |
9.25 (5.05 – 16.38) |
Value has tended to perform particularly well in higher inflation periods but lagged other factors in low to moderate inflationary environments, such as those of the last decade or so. With rising inflation often comes rising rates, and this rise in rates tends to lead to a reduction in price multiples, also known as multiple compression. Because value stocks already trade at lower multiples, they suffer less of a loss from compression than their growth counterparts do when rates rise. Similarly, value stocks are generally considered shorter duration assets compared to growth stocks, which have higher expectations for future growth, and so they tend to fall less than growth stocks when rates rise.
Inflationary effects on factor volatility
Inflation is only one factor that both contributes to and results from the broader economic and business cycle environment affecting factor performance across these periods. Noted in the table above are other economic indicators: average year-over-year GDP growth and average federal funds rate3. Average GDP results from these various timeframes are relatively intuitive - slow growth coincides with lower inflation while the highest growth coincides with modestly high to high inflation before the Fed takes action to slow high inflation through such mechanisms as a higher fed funds rate. Note though that the averages listed here gloss over the wide range of outcomes (shown in parentheses) experienced across very different economic environments. Clearly idiosyncratic economic events are also at play across this history.
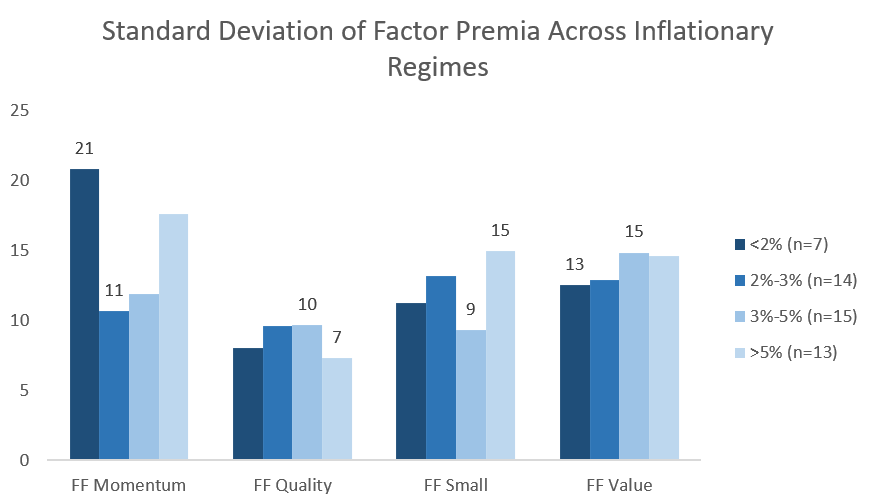
The changing volatility of factor premia across inflationary regimes underscores the multitude of inputs that affect performance. The chart below shows each factor’s standard deviation across these regimes and displays the highest and lowest volatility figures. Not surprisingly, momentum shows the largest variation, as its fortunes are tied largely to the whipsaws of the market environment and business cycle. Quality has had the lowest standard deviation of returns across inflationary regimes, which is likely the result of its tendency to be favored by long-term institutional investors, greater ability of these companies to pass on price increases to consumers, and a lower beta profile. The volatility of the value premia has shown the most consistency across inflationary regimes. Not unexpectedly, the highest inflationary periods have also tended to be periods of higher volatility for these factor premia.
Finding inflation’s footing
Shifting its focus away from achieving full employment following the economic fallout from the pandemic shutdown, the Fed has now begun taking aggressive action to counteract inflation through rate increases and balance sheet reduction. Still, fears of a return to long gas lines, commodity shortages, and the anemic investment returns experienced during the painfully high double-digit inflationary environment of the 1970s and 1980s have no doubt caused some anxiety to investors who experienced them firsthand, but these fears may be premature.
Comparing the current economic regime with the high inflationary environment witnessed in the 1970s to 1980s suggests some important structural differences. Among these differences are greater energy independence in the US (dampening the effects of an oil embargo), floating exchange rates (mitigating the effect of a run on the dollar to which main global currencies had been fixed in the 70s), and lower union participation from US workers (lessening the impact of collective bargaining on domestic wages).
These structural differences suggest we may avoid a repeat of the extended, excessive inflationary environment experienced before. However, real inflationary risks remain in the form of massive government stimulus, continued supply chain disruptions and a tight labor market. Factors will be affected by these dynamics, but no matter where this current period lands on the timeline of inflationary history, factor premia will continue to be an important component of overall portfolio return.
Glossary
Factor Definitions
Value: The tendency for cheap assets to outperform expensive assets. (See Basu, S. “Investment Performance of Common Stocks in Relation to Their Price-Earnings Ratios: A Test of the Efficient Market Hypothesis.” Journal of Finance, 1977.)
Momentum: The tendency for assets that have performed well over the past year to continue to perform well over the near-term. (See Jegadeesh, N and S. Titman. “Returns to Buying Winners and Selling Losers: Implications for Stock Market Efficiency.” The Journal of Finance, 1993.)
Quality: The tendency for higher quality companies – those that are more profitable and safer – to outperform lower quality companies. (See Novy-Marx, R. “The Other Side of Value: The Gross Profitability Premium.” Journal of Financial Economics, 2013.)
Minimum Volatility: The tendency for lower beta, less volatile stocks to outperform higher beta, more volatile stocks. (See Ang, A., Hodrick, R. Xing, Y. and X. Zhang. “The Cross-Section of Volatility and Expected Returns.” The Journal of Finance, 2006.)
Size: The tendency for small capitalization stocks to outperform large capitalization stocks. (See Banz, R. “The Relationship Between Return and Market Value of Common Stocks.” Journal of Financial Economics, 1981.)
Benchmark Definitions
The MSCI USA Momentum Index is designed to reflect the performance of an equity momentum strategy by emphasizing large and mid cap US stocks with high price momentum.
The MSCI USA Quality Index is designed to capture the performance of large and mid cap US quality growth stocks by identifying stocks with high quality scores based on three main fundamental variables: high return on equity (ROE), stable year-over-year earnings growth and low financial leverage.
The MSCI USA Minimum Volatility is designed to reflect the performance characteristics of a minimum variance strategy applied to the large and mid cap US equity universe by optimizing the MSCI USA Index for the lowest absolute risk (within a given set of constraints).
The MSCI USA Enhanced Value Index is designed to represent the performance of large- and mid-cap US equity securities that exhibit higher value characteristics relative to their peers within the corresponding GICS® sector. The value investment style characteristics are defined using price-to-book, price-to-forward earnings, and enterprise value-to-cash flow from operations.
The MSCI USA Small Cap Index is designed to measure the performance of the small cap segment of the US equity market.
The MSCI World ex USA Momentum Index is designed to reflect the performance of an equity momentum strategy by emphasizing large and mid cap stocks across developed market countries excluding the US with high price momentum.
The MSCI World ex USA Quality Index is designed to capture the performance of quality growth stocks by identifying stocks of large and mid cap stocks across developed market countries excluding the US with high quality scores based on three main fundamental variables: high return on equity (ROE), stable year-over-year earnings growth and low financial leverage.
The MSCI World ex USA Minimum Volatility Index is designed to reflect the performance characteristics of a minimum variance strategy applied to the MSCI large and mid cap equity universe across developed market countries excluding the US by optimizing the MSCI World ex USA Index for the lowest absolute risk (within a given set of constraints).
The MSCI World ex USA Enhanced Value Index is designed to represent the performance of large- and mid-cap universe across developed market countries excluding the US that exhibit higher value characteristics relative to their peers within the corresponding GICS® sector. The value investment style characteristics are defined using price-to-book, price-to-forward earnings, and enterprise value-to-cash flow from operations.
The MSCI World ex USA Small Cap Index is designed to measure the performance of the small cap equity universe across developed market countries excluding the US.
The MSCI USA Growth Index is designed to represent US large and mid cap securities exhibiting overall growth style characteristics as measured by five growth variables.
Sources:
1. Ken R. French http://mba.tuck.dartmouth.edu/pages/faculty/ken.french/index.html
2. Consumer Price Index Data, Federal Reserve Bank of Minneapolis, https://www.minneapolisfed.org/about-us/monetary-policy/inflation-calculator/consumer-price-index-1913-
3. U.S. Bureau of Economic Analysis (BEA), https://www.bea.gov/
Past performance is not indicative of future results. The information, analysis and opinions expressed herein are for informational purposes only and do not necessarily reflect the views of Envestnet. These views reflect the judgment of the author as of the date of writing and are subject to change at any time without notice. Nothing contained in this piece is intended to constitute legal, tax, accounting, securities, or investment advice, nor an opinion regarding the appropriateness of any investment, nor a solicitation of any type.