Commentaries
Economic and Market Overview: Fourth Quarter 2014
The following commentary summarizes prior financial market activity and uses data obtained from public sources. This commentary is provided to financial advisors and their clients as a resource for the management of assets and evaluation of investment portfolio performance.
The Economy
 The domestic economic landscape continued to demonstrate solid improvement in the fourth quarter, building upon the gains of the prior three months. The Bureau of Labor Statistics raised its third estimate of third quarter gross domestic product (GDP) to a better-than-expected +5.0%. Combined with the second quarter’s growth of +4.6%, it represented the first time since 2003 that GDP growth exceeded 4% in two straight quarters. As with the prior quarter, the gains in the third quarter were again led by an increase in consumer spending. The gain in spending was in turn powered by a strong employment situation, lower oil prices and record stock prices. The employment situation delivered much better-than-expected results, with an average of about 278,000 jobs added each month during the quarter. The unemployment rate also declined to 5.8%, a new cycle low.
Globally, the situation wasn’t quite as rosy. The eurozone’s economy continues to sputter, and has even had a renewed bout of sovereign debt issues in Greece. Economists expect that the region will continue to generate tepid growth in the first part of 2015.
Economists expect China to continue to be the key engine for growth in the Asia-Pacific region, but policymakers may need to enact additional stimulus in 2015 to prop up growth. The country is suffering from a cooling property market, as well as excess capacity in many industries. The region’s economy should benefit from lower oil prices. During the fourth quarter the Federal Open Market Committee (FOMC) modified the language used regarding how long it would keep the fed funds rate low. The committee replaced text stating that rates would remain near 0% for a “considerable time” with language saying that it would be “patient” in determining the course of rates. Many economists continue to believe that the Fed will begin to raise rates sometime in the second half of 2015.
Highlights and Perspectives
 GROSS DOMESTIC PRODUCT (GDP)
The Bureau of Economic Analysis released the third estimate of the third quarter 2014 real GDP, a seasonally adjusted annualized rate of +5.0%, up from the +4.6% annualized growth of the prior quarter, and an increase from the prior estimate of +3.9% growth. The third quarter’s result was the best since 2003, and is particularly impressive since it followed strong growth from the second quarter. The growth was driven primarily continued improvement in consumer spending, with trade, fixed investment and federal government also contributing. Analysts attribute the acceleration in growth to the continued improvement in the employment situation and the slide in oil prices. But the main reason for the growth was the reduction in the fiscal drag. Government spending, led by defense spending, made its largest contribution to growth since 2009. Corporate profits rose by +3.1% (not annualized), after having jumped +8.4% in the prior quarter. Consumer spending grew at the same rate as GDP over the past four quarters, gaining as a result of the improving job market. Inflation moderated during the quarter, with the personal consumption expenditures (PCE) index of prices gaining +1.2% during the quarter, down from the +2.3% rate of the prior quarter. Economists are generally encouraged with the economy’s expansion, and believe the growth should continue. However, the U.S. economy is diverging from the rest of the world, and may not be immune to the issues impacting many other economies.
HOUSING
The housing segment’s uptrend remained on course in the fourth quarter, primarily as a result of mortgage rates that remain below 4% and the lowest level of unemployment in six years. Existing-home sales for November (the latest monthly data available) advanced at an annualized rate of 4.9 million units, slightly down from the level 5.25 million unit rate reached in October, but up about +2.1% from November 2013. November sales were the slowest since May. The inventory of existing homes remained relatively tight, with 5.1 months of supply. Existing-home prices in November were down slightly from October, but remain up +5.6% from year-ago levels. In the new-home segment, the NAHB Housing Market Index, a measure of homebuilding activity, ended the quarter at a level of 57, down slightly from the previous quarter’s reading of 59. Despite the modest decline, the index is hovering near the highest levels in nine years, signaling the housing recovery remains on course. Economists, however, remain concerned that a likely move by the Federal Reserve to raise interest rates will dampen activity in 2015.
EMPLOYMENT
The employment situation improved dramatically in the fourth quarter of 2014. Employers added 321,000 jobs during November, a significant jump from the 203,000 jobs added in August. The three-month moving average was 278,000, a good indication of the solid improvement in the economy. Professional/business services and retail were the primary drivers of November’s strong results, which respectively accounted for 86,000 and 50,000 new jobs for the month. The unemployment rate in November remained unchanged from the prior month at 5.8%, but down from the 6.1% level of August. Analysts believe that steady payroll gains should continue, and that the unemployment rate should trend down toward 5% in 2015.
FED POLICY
The Federal Open Market Committee (FOMC), having completed its asset purchase program in October, began to subtly alter the language used in its post-meeting statement, removing the language stating that interest rates would remain low for a “considerable time.” The FOMC replaced it with text saying it would be “patient” in determining the course for interest rates. Many economists consider this language to be somewhat dovish, enabling the FOMC to gauge the economic landscape over the next few quarters, but not necessarily altering the perception that rates will begin to rise in mid-2015. The FOMC likely wanted to allow itself some wiggle room to assess how the decline in inflation and the global slowdown impacts the domestic economy. Analysts expect that the FOMC will want to wait until the fed funds rate begins to rise before reducing the size of its balance sheet.
INTEREST RATES
In the fourth quarter, fixed-income securities generally posted solid gains, more than recovering the modest losses of the third quarter. Investors grappled with several issues during the quarter, including the long-awaited end of the Federal Reserve’s asset purchase program, slowing global growth, and a slide in oil prices. U.S. Treasury securities continued to meet strong demand with investors seeking safety and higher yields amid global uncertainty. Treasury yields were little changed in December after having declined in both October and November. Investors are now looking ahead to the prospect of higher yields as the Fed begins to normalize interest rates following a long period of accommodation.
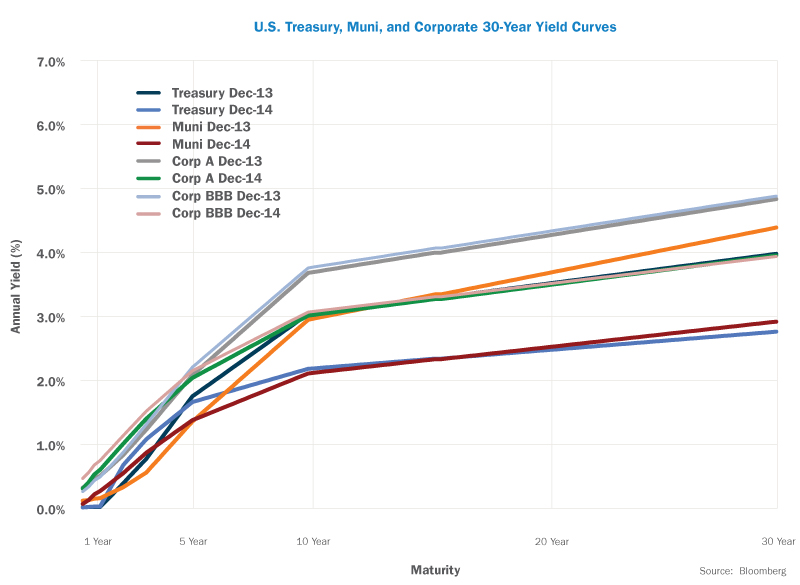
Within this environment, the shape of the yield curve continued to flatten, with short-term rates rising relative to intermediate- and long-term rates. By the end of the quarter, the yield on the benchmark 10-year U.S. Treasury ended up much lower than where it began, dropping to 2.17% from 2.49% on September 30th. Yields declined precipitously for the first two months of the quarter, in part due to the divergence in economic growth between the U.S. and much of the rest of the world. Yields stabilized throughout December, with investors pivoting to anticipate a rise in short-term interest rates.
Yield changes were most significant in the short-term segment of the yield curve. The yield on the 3-month T-bill climbed to 0.04% at the end of the quarter, up from 0.02% at the end of the previous quarter. The yield on the five-year Treasury eased modestly, ending the quarter at 1.65%, compared to 1.76% on September 30th, and as mentioned above, the yield on the 10-year Treasury declined to 2.17% from 2.49% over the same period. At the same time, the yield on the 30-year Treasury declined to 2.75% from 3.20% during the quarter. Inflation expectations continue to be very well contained, with the Fed’s gauge of five-year forward inflation expectations closing at 1.98% on December 31st, down from 2.17% on September 30th.
Credit securities experienced modest price declines in the quarter, with yields inching higher. The yield on the Barclays 1-3 Year Credit Index rose to 1.38% from 1.18% during the quarter. Intermediate credit yields were a bit lower, with the yield on the Barclays 7-10 Year Credit Index falling to 3.47% on December 31st from 3.59% on September 30th. Yields on high-yield securities continued a trend higher during the quarter. The yield on the Barclays U.S. Corporate High Yield Index climbed to 6.90% from 6.44% at the end of the third quarter.
Municipal bonds produced another quarter of fine results, due in large part to continued improvement in the finances of states and municipalities. As a result, municipal yields trended lower during the quarter, with the yield on the Barclays Municipal Bond index dropping to 2.09% at the end of the quarter from 2.19% as of September 30th.
In terms of total returns, fixed-income securities generally produced positive results in the quarter, with U.S. Treasury, municipal and certain aggregate indices generating gains. The Barclays Treasury 5-7 Yr. Index gained +1.83%, and the Barclays U.S. Corporate 5-10 Yr. Index advanced +1.48% during the quarter. High yield securities were the weakest in the domestic fixed income space, declining -1.00%. The top performing index for the quarter was the Barclays U.S. Aggregate Bond Index, which rose +1.79%, largely as a result of its exposure to U.S. Treasury securities. The Aggregate Bond Index gained +5.97% for the entire year. The Barclays Global Aggregate ex-U.S. Index declined -2.99% for the quarter, finishing the year with a loss of -3.08%.
 EQUITIES
The fourth quarter began inauspiciously, with most major indices declining more than 5% in the first two weeks of October. Concerns about the global growth outlook and the end of the Fed’s asset purchase program were the primary culprits. However, continued improvement in economic data in the U.S., the ongoing decline in oil prices, and positive seasonal trends all contributed to an explosive rebound that commenced in mid-October. The S&P 500 rocketed +8.4% in the final two weeks of the month, closing out October with a +2.4% gain. The rally continued through November, partly as a result of investor encouragement with the results of the mid-term elections, as well as with the better-than-expected employment report. In December, a -4.5% decline in the S&P 500 during the first two weeks of the month put the string of six consecutive December monthly gains in such jeopardy that even a powerful rally in the back half of the month couldn’t overcome. As a result, the S&P 500 fell by -0.25%, its first December decline since 2007. Nevertheless, the index advanced +4.9% for the quarter, and was up +13.7% for the year, its sixth consecutive calendar year of gains.
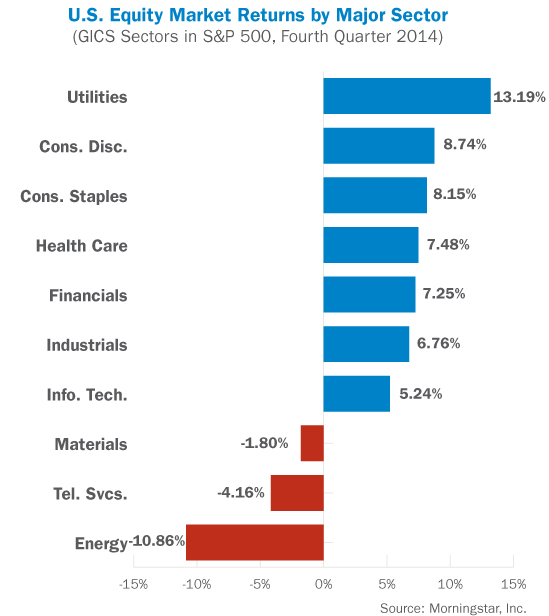
Probably more so than in other recent quarters, performance dispersion among the ten primary economic sectors was extremely varied, placing a premium on sector and security selection. The utilities sector was by far the best performer in the fourth quarter, posting a gain of +13.2%. In a rare occurrence, the sector was also the best performer on a year-to-date basis, advancing +29.0%. Consumer discretionary also delivered strong results, with a gain of +8.7%. The energy sector was once again the poorest performing during the quarter, declining -10.7% as a result of the severe slide in crude oil prices. Energy was also the worst performing sector for the year, declining -7.8%. Telecommunication services also fared poorly on a relative basis with a loss of -4.2%.
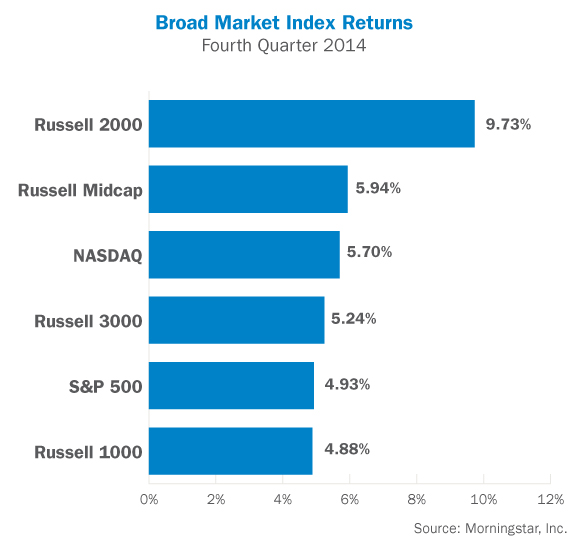
For the quarter, the Russell 1000 Index of large capitalization stocks generated a +4.9% total return. Within the large cap segment, value stocks slightly outperformed growth stocks. Small capitalization stocks, as represented by the Russell 2000 Index, finally showed signs of life relative to large caps, ending with a total return of +9.7%. For the year, small caps underperformed large caps by more than 830 basis points. Growth outperformed value within the small cap universe. The Nasdaq Composite, dominated by information technology stocks, generated a return of +5.7% during the quarter. The Dow Jones Industrial Average of 30 large industrial companies gained +5.2% during the quarter, and was up +10.0% for the full year.
Real Estate Investment Trusts (REITs) rallied sharply in the fourth quarter, primarily a result of moderating interest rates. The DJ US Select REIT Index gained +15.1% during the quarter, bringing its full-year gain to +32.0%. Commodities plunged during the fourth quarter, with energy prices at multi-year lows. As a result, commodities posted a third consecutive quarter of poor performance, with the Bloomberg Commodity Index dropping -12.1% for the quarter ended December 31st. The index declined -17.0% for the full year.
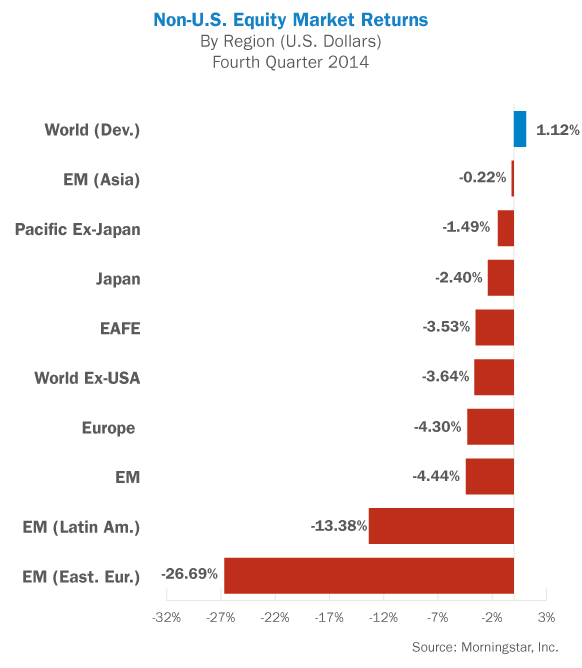
International stocks again underperformed U.S. equities in the fourth quarter. Europe continues to be mired in a slow growth environment, with renewed concerns emerging about countries such as Greece. Performance outside the U.S. was generally negative in the fourth quarter, with China being the only primary market generating gains. The MSCI ACWI ex-USA Index, which measures performance of world markets outside the U.S., declined -3.8% in the fourth quarter, as both developed and emerging markets declined. The MSCI EAFE Index of developed markets stocks declined by -3.5% during the same period. Regional performance was generally negative across the board. China and Asia were the strongest relative performers, with the MSCI China and MSCI EM Asia indices posting returns of +7.1% and -0.2%, respectively. Emerging markets performance was again negative on an absolute basis for the quarter, and also underperformed developed markets indices. The MSCI Emerging Markets Index posted a loss of -4.4% for the quarter, bringing its full-year return to -1.8%.
Outlook
Domestically, recent economic trends would indicate that the economy is beginning to generate the kind of growth many analysts had expected this far along in the recovery. Third quarter GDP growth came in at its highest rate since 2003, powered by consumer spending and business investment. The consensus among economists is that the upturn in the U.S. economy should be sustained into 2015, fueled by lower unemployment and stronger wage growth. Higher income should generate increased spending, construction and investment, and enable real GDP growth to exceed 3% in 2015 and 2016, even while the Federal Reserve raises interest rates and reduces its balance sheet. Globally, economies outside of the U.S. underperformed the U.S., but economists believe they are poised to recover beginning in the second quarter of 2015. China and other Asian economies are expected to lead the way. As always, there are certain risks to what is generally a positive outlook, including investor fear that the Federal Reserve is tightening too quickly, a resurrection of the eurozone’s sovereign debt issues, and policy missteps by China’s policymakers.
The information, analysis, and opinions expressed herein are for general and educational purposes only. Nothing contained in this quarterly review is intended to constitute legal, tax, accounting, securities, or investment advice, nor an opinion regarding the appropriateness of any investment, nor a solicitation of any type. All investments carry a certain risk, and there is no assurance that an investment will provide positive performance over any period of time. An investor may experience loss of principal. Investment decisions should always be made based on the investor’s specific financial needs and objectives, goals, time horizon, and risk tolerance. The asset classes and/or investment strategies described may not be suitable for all investors and investors should consult with an investment advisor to determine the appropriate investment strategy. Past performance is not indicative of future results.
Information obtained from third party sources are believed to be reliable but not guaranteed. Envestnet | PMC™ makes no representation regarding the accuracy or completeness of information provided herein. All opinions and views constitute our judgments as of the date of writing and are subject to change at any time without notice.
Investments in smaller companies carry greater risk than is customarily associated with larger companies for various reasons such as volatility of earnings and prospects, higher failure rates, and limited markets, product lines or financial resources. Investing overseas involves special risks, including the volatility of currency exchange rates and, in some cases, limited geographic focus, political and economic instability, and relatively illiquid markets. Income (bond) securities are subject to interest rate risk, which is the risk that debt securities in a portfolio will decline in value because of increases in market interest rates. Investing in commodities can be volatile and can suffer from periods of prolonged decline in value and may not be suitable for all investors. Index Performance is presented for illustrative purposes only and does not represent the performance of any specific investment product or portfolio. An investment cannot be made directly into an index.
INDEX OVERVIEW
The S&P 500 Index is an unmanaged index comprised of 500 widely held securities considered to be representative of the stock market in general. The S&P/Case-Shiller Home Price Indices measure the residential housing market, tracking changes in the value of the residential real estate market in 20 metropolitan regions across the United States. The Morgan Stanley EAFE Index represents 21 developed markets outside of North America. The MSCI Emerging Markets Index is a free float-adjusted market capitalization index that is designed to measure equity market performance in the global emerging markets. The Barclays U.S. Aggregate Bond Index is a market capitalization-weighted index of investment-grade, fixed-rate debt issues, including government, corporate, asset-backed, and mortgage-backed securities, with maturities of at least one year. The Barclays U.S. Corporate High Yield Index covers the USD-denominated, non-investment grade, fixed-rate, taxable corporate bond market. Securities are classified as high-yield if the middle rating of Moody’s, Fitch and S&P is Ba1/BB+/BB+ or below. The index may include emerging market debt. The Barclays Municipal Bond Index is an unmanaged index comprised of investment-grade, fixed-rate municipal securities representative of the tax-exempt bond market in general. The Barclays 1-3 Year Credit Index includes publicly issued U.S. corporate and specified foreign debentures and secured notes that are rated investment-grade (BBB- or higher) by at least two of the major ratings agencies, have maturities between one and three years, and have at least $250 million par amount outstanding. The Barclays 7-10 Year Credit Index includes publicly issued U.S. corporate and specified foreign debentures and secured notes that are rated investment-grade (BBB- or higher) by at least two of the major ratings agencies, have maturities between seven and ten years, and have at least $250 million par amount outstanding. The DJ-UBS Commodity Index Total ReturnSM measures the collateralized returns from a basket of 19 commodity futures contracts representing the energy, precious metals, industrial metals, grains, softs and livestock sectors. The Russell 1000 Index is a market capitalization-weighted benchmark index made up of the 1000 largest U.S. companies in the Russell 3000 Index (which comprises the 3000 largest U.S. companies). The Russell Midcap Index is a subset of the Russell 1000 Index. It includes approximately 800 of the smallest securities based on a combination of their market cap and current index membership. The Consumer Price Index (CPI) measures the change in the cost of a fixed basket of products and services. The Gross Domestic Product (GDP) rate is a measurement of the output of goods and services produced by labor and property located in the United States.
© 2015 Envestnet | PMC. All rights reserved