Commentaries
Economic and Market Overview: Third Quarter 2014
The following commentary summarizes prior financial market activity and uses data obtained from public sources. This commentary is provided to financial advisors and their clients as a resource for the management of assets and evaluation of investment portfolio performance.
The Economy
 The domestic economic landscape improved markedly in the third quarter, emerging from a first half that did not quite live up to expectations. The Bureau of Labor Statistics raised its third estimate of second quarter gross domestic product (GDP) to +4.6%, a robust about-face from the -2.9% contraction of the first quarter. The reversal did not come as a surprise, as many economists had noted that economic data was exhibiting strength in many segments. The gains in the third quarter were led by an increase in consumer spending, which was fueled by an improving employment situation, record stock prices, and firming housing values. The employment situation was somewhat mixed during the quarter, with an average of about 207,000 jobs added each month during the quarter. The unemployment rate also declined to 6.1%, a cycle low.
Globally, the recovery has been a bit more challenging. While the U.S. and Canada have seemingly turned the corner towards acceleration, the eurozone’s economy has had a difficult time generating steam, and continues to be hampered by high levels of unemployment and large amounts of debt. The recent decline in the euro should help exports, and could perhaps serve as a catalyst for sustained improvement. Japan’s economy has slowed considerably following an April sales tax increase.
Economists expect China to remain a key driver of global growth going forward, but policymakers will be seeking to manage an unwinding of the credit bubble and a cooling off of the property market without adversely impacting other areas of the economy. Still, recent data suggest that the economy will end the year below the 7.5% annual growth target, and policymakers may take further stimulus measures to mitigate a further slowdown.
 During the third quarter the Federal Open Market Committee (FOMC) affirmed its commitment to keeping the fed funds rate near 0% for a “considerable time,” language that many economists believe will be altered during the committee’s December meeting. In addition, the FOMC further reduced its asset purchase program, and stated that it will end in October. A growing consensus among economists is that the FOMC will begin to raise the fed funds rate sometime in the latter half of 2015.
The domestic economic landscape in the second quarter remained mixed, after the effects of severe weather in the first quarter lingered. The Bureau of Labor Statistics lowered its third estimate of first quarter gross domestic product (GDP) to -2.9%, reflecting a broad-based contraction in many areas of the economy, including consumer spending, exports and business investment. It was the largest decline in GDP in five years. The employment situation continued its trend of modest improvement, with an average of about 200,000 jobs added each month during the quarter. In addition, payroll employment finally exceeded the pre-financial crisis peak, having recovered the 8.7 million jobs lost in the recession.
Highlights and Perspectives
Gross Domestic Product (GDP)
The Bureau of Economic Analysis released the third estimate of the second quarter 2014 real GDP, a seasonally adjusted annualized rate of +4.6%, up from the -2.9% annualized growth of the prior quarter, and an increase from the prior estimate of +4.2% growth. The growth was primarily a result of accelerating consumer spending, fixed investment, exports, and inventory investment. Analysts attribute part of the pickup in growth to the winding down of fiscal austerity, as state and local governments begin to loosen their purse strings. Government spending made a significant contribution to the second quarter’s growth. Corporate profits rose by 8.4% (not annualized), after having declined 9.4% in the prior quarter. Consumer spending grew as a result of improvement in the number of high-quality jobs, low debt service requirements, record stock values, and continued improvement in housing prices. Inflation was higher but remains relatively stable, with the personal consumption expenditures (PCE) index of prices gaining 2.3% during the quarter, up from the 1.4% rate of the prior quarter. The consensus among economists is that the economy will continue to strengthen, supported by continued improvement in job growth and a pickup in homebuilding.
Housing
Despite somewhat of a slowdown in demand over the past three months, the housing segment’s uptrend remains on track. The segment should continue to improve, as affordability is high and job growth accelerates. Existing-home sales for August (the latest monthly data available) advanced at an annualized rate of 5.1 million units, slightly down from the level 5.14 million unit rate reached in July, and off about 5.3% from August 2013. The inventory of existing homes is relatively tight, with 5.6 months of supply. Existing-home prices in August were down slightly from the peak in June, but are still up 4.8% from year-ago levels. In the new-home segment, the NAHB Housing Market Index, a measure of homebuilding activity, ended the quarter at a level of 59, up significantly from the previous quarter’s reading of 49, and the highest level since November 2005. The index has now risen in each of the past four months. Economists continue to believe that due to a low inventory of homes, a continued rebound in housing is likely.
Employment
The employment situation turned in a mixed performance during the third quarter of 2014. Employers added only 142,000 jobs during August, down from the 229,000 level of May. The three-month moving average was 207,000, a modest level, but likely enough to continue to lower unemployment. Manufacturing and retail were the primary culprits responsible for August’s lackluster results, which respectively accounted for zero and -8,000 jobs for the month. The unemployment rate in August declined to a cycle low of 6.1% as the labor force participation rate eased. While August’s report was disappointing, housing analysts believe that the underlying employment situation remains robust, as job growth in higher quality segments of the economy was strong.
Fed Policy
The Federal Open Market Committee (FOMC), for the seventh consecutive meeting, decided to reduce its monthly asset purchases by $10 billion in September. The FOMC will now be buying $10 billion of Treasury securities and $5 billion of mortgage-backed securities, down from a total of $85 billion at the peak. In addition, the FOMC also announced in its accompanying statement that it would end the program at its next meeting in October. In somewhat of a surprise to analysts, the FOMC decided to retain language in the statement saying that it would maintain a low fed funds rate for a “considerable time” after the ending of the asset purchase program. However, the consensus among economists is that the language will be modified in an upcoming meeting. The FOMC also indicated that the fed funds rate will reach its neutral rate by 2017.
Interest Rates
In the third quarter, fixed income securities could not extend the gains posted in the first and second quarters. Competing issues provided cross-currents for bond indices. On the one hand, improving economic trends and expectations for an eventual increase in the fed funds rate tended to put upward pressure on yields. At the same time, however, U.S. Treasury securities were sought after for their safe haven status as geopolitical strife mounted, keeping yields on Treasuries constrained. Yields made a decided push higher in September as second quarter GDP came in very strong, and as investors anticipate the end to the Fed’s asset purchase program in October.
Within this environment, the shape of the yield curve flattened considerably, as short-term rates rose, intermediate-term yields were little changed and long-term rates declined. During the quarter, strong performance in August was sandwiched by relatively weak performance in July and September. By the end of the quarter, the yield on the benchmark 10-year U.S. Treasury had ended up close to where it began, easing to 2.49% from 2.53% on June 30th. Yields trended lower through the end of August, partly as a result of geopolitical tensions with Russia and in the Middle East, but abruptly reversed course through September.
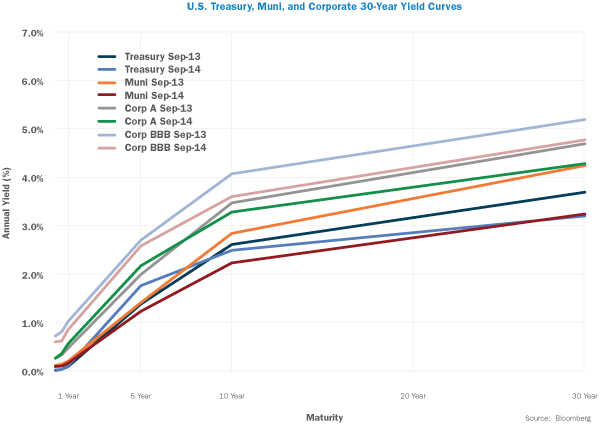
With a backdrop of accelerating growth, anticipation of eventual fed funds rate normalization and enough turmoil abroad to warrant military intervention, yield changes were varied across the yield curve. The yield on the 3-month T-bill remained steady at 0.02% at the end of the third quarter, down slightly from the previous quarter. The yield on the 5-year Treasury rose somewhat, ending the quarter at 1.76%, compared to 1.63% on June 30th, and as mentioned above, the yield on the 10-year Treasury edging lower to 2.49% from 2.53% over the same period. At the same time, the yield on the 30-year Treasury declined to 3.20% from 3.36% during the quarter. Inflation expectations continued to be very well contained, with the Fed’s gauge of five-year forward inflation expectations closing at 2.21 % on September 30th, down modestly from 2.45% on June 30th.
Credit securities also suffered during the quarter, with prices generally declining and yields ticking higher. The yield on the Barclays 1-3 Year Credit Index rose moderately to 1.18% from 0.97% during the quarter. Intermediate credit yields were also somewhat higher, with the yield on the Barclays 7-10 Year Credit Index rising to 3.59% on September 30th from 3.41% on June 30th. As would be expected during a quarter of volatile equity markets, yields on high-yield securities moved higher. The yield on the Barclays U.S. Corporate High Yield Index jumped to 6.44% from 5.72% at the end of the second quarter.
Municipal bonds once again delivered solid results during the third quarter, driven by the winding down of fiscal austerity and improvement in the financial health of state and local governments. As a result, municipal yields trended lower during the quarter, with the yield on the Barclays Municipal Bond index dropping to 2.19% at the end of the quarter from 2.36% as of June 30th.
In terms of total returns, fixed income securities produced mixed results in the quarter, with municipal and certain aggregate indices providing gains, but most other segments turning in negative performance. The Barclays Treasury 5-7 Year Index declined -0.05%, and the Barclays U.S. Corporate 5-10 Year Index gave up -0.20% during the quarter. High-yield securities were among the weakest in the fixed income space, declining -1.87%. At the other end of the spectrum, municipals produced another quarter of solid performance, as the Barclays Municipal Bond Index rose +1.49% for the quarter. The index is up +7.58% on a year-to-date basis. The poorest performing segment during the quarter was international fixed income, with the Barclays Global Aggregate ex-U.S. Index declining -5.38%.
Equities
 The third quarter started on a difficult note, with performance in July mostly negative as investors booked profits after five consecutive months of gains. However, August’s performance was once again very strong, coinciding with a continued uptrend in economic data. By September, investors were faced with various concerns, including the prospect that the Fed would eventually need to begin raising interest rates, and likely sooner than anticipated; slowing growth in China and pro-democracy protests in Hong Kong; and the recently initiated military campaign to thwart the advance of ISIS. As a result, volatility picked up over the prior quarter. The Chicago Board Options Exchange SPX Volatility Index – better known as VIX – finished the quarter at 16.3, up 41% from the multi-year low established at the end of the second quarter. Despite the rise in volatility, the S&P 500 was able to eke out a slight gain. For the quarter overall, the S&P 500 advanced +1.13%, its seventh consecutive quarter of gains, the longest streak the index posted gains in 14 straight quarters from 1995-1998. The index has advanced +8.34% on a year-to-date basis.
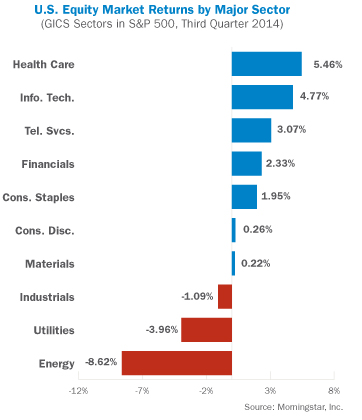
Performance dispersion among the ten primary economic sectors continues to be broad, an indication that sector and stock selection is becoming more vital. The health care sector was the best performer in the third quarter, posting a gain of +5.46%; the sector is also the best performer on a year-to-date basis. Information technology also posted strong results, with a solid gain of +4.77%. The energy sector was the poorest performer during the quarter, declining -8.62% as a result of slackening demand for crude oil. Utilities also fared poorly on a relative basis with a loss of -3.96%, primarily as a result of its sensitivity to rising interest rates.
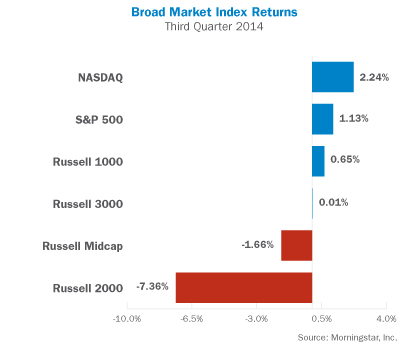
For the quarter, the Russell 1000 Index of large capitalization stocks generated a +0.65% total return. Within the large cap segment, growth stocks outperformed value stocks. Small capitalization stocks, as represented by the Russell 2000 Index, continued to perform very weakly relative to large caps, ending with a total return of -7.36%. On a year-to-date basis, small caps have underperformed large caps by more than 1200 basis points. As in the large cap segment, growth outperformed value within the small cap universe. The Nasdaq Composite, dominated by information technology stocks, generated a return of +2.24% during the quarter. The Dow Jones Industrial Average of 30 large industrial companies gained +1.87% during the quarter, and is up a modest +4.60% on a year-to-date basis.
Real Estate Investment Trusts (REITs) experienced a reversal in performance during the third quarter, in part as a result of rising interest rates in September. The DJ US Select REIT Index declined -3.00% during the quarter, lowering its year-to-date gain to +14.69%. Commodities extended their slide during the third quarter, in part due to sluggish economic growth in many areas of the world, but also as a result of the strength in the U.S. dollar. Many commodities are denominated in U.S. dollars, and as the dollar strengthens, prices decline, all else equal. As a result, commodities posted a second consecutive quarter of poor performance, with the Bloomberg Commodity Index plunging -11.83% for the quarter ended September 30th.
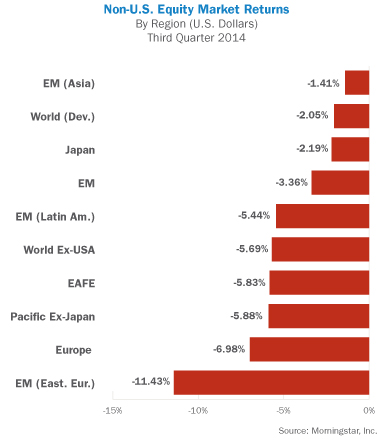
International stocks significantly underperformed U.S. equities in the third quarter. The eurozone continues to struggle with tepid economic growth, prompting the European Central Bank to maintain an aggressive monetary posture, which includes imposing a negative interest rate of -0.10% on funds held with the central bank. Performance was generally negative throughout the world in the third quarter, with only limited pockets of gains. The MSCI ACWI ex-USA Index, which measures performance of world markets outside the U.S., declined -5.19% in the third quarter, as both developed and emerging markets declined. The MSCI EAFE Index of developed markets stocks retreated by -5.83% during the same period. Regional performance was generally negative across the board. China and Asia were the strongest relative performers, with the MSCI China and MSCI EM Asia indices posting returns of +0.28% and -1.41%, respectively. Emerging markets performance was negative on an absolute basis for the quarter, but managed to continue its positive performance relative to developed markets indices. The MSCI Emerging Markets Index posted a loss of -3.36% for the quarter, bringing its year-to-date return to +2.75%.
Outlook
The second quarter GDP data provides an indication of the improving strength of the U.S. economy, and there are other reasons why many economists believe this growth could accelerate into the fourth quarter and beyond. First, consumers have been a primary contributor to the rebound from the winter’s doldrums. Stronger employment growth (especially in higher quality jobs), record stock prices, and rebounding housing values have given consumers confidence to increase discretionary spending. Second, businesses are beginning to make more investments as a result of record profitability. Third, the fiscal drag of the past few years is now diminishing, with the federal government now being on more solid fiscal ground, and state and local governments in better financial position. Finally, as evidenced by the stock market’s march to record highs, the U.S. economy seems to be shrugging off the geopolitical instability that has ramped up this year. Potential risks to a continued improvement in the economy would include further slowing in China’s growth, which would cause repercussions in emerging markets; a monetary policy misstep as the Fed exits its asset purchase program and decides on a timetable to begin raising interest rates, and an inability of eurozone policymakers to jump-start the region’s growth.
The information, analysis, and opinions expressed herein are for general and educational purposes only. Nothing contained in this quarterly review is intended to constitute legal, tax, accounting, securities, or investment advice, nor an opinion regarding the appropriateness of any investment, nor a solicitation of any type. All investments carry a certain risk, and there is no assurance that an investment will provide positive performance over any period of time. An investor may experience loss of principal. Investment decisions should always be made based on the investor’s specific financial needs and objectives, goals, time horizon, and risk tolerance. The asset classes and/or investment strategies described may not be suitable for all investors and investors should consult with an investment advisor to determine the appropriate investment strategy. Past performance is not indicative of future results.
Information obtained from third party sources are believed to be reliable but not guaranteed. Envestnet | PMC™ makes no representation regarding the accuracy or completeness of information provided herein. All opinions and views constitute our judgments as of the date of writing and are subject to change at any time without notice.
Investments in smaller companies carry greater risk than is customarily associated with larger companies for various reasons such as volatility of earnings and prospects, higher failure rates, and limited markets, product lines or financial resources. Investing overseas involves special risks, including the volatility of currency exchange rates and, in some cases, limited geographic focus, political and economic instability, and relatively illiquid markets. Income (bond) securities are subject to interest rate risk, which is the risk that debt securities in a portfolio will decline in value because of increases in market interest rates. Investing in commodities can be volatile and can suffer from periods of prolonged decline in value and may not be suitable for all investors. Index Performance is presented for illustrative purposes only and does not represent the performance of any specific investment product or portfolio. An investment cannot be made directly into an index.
Index Overview
The S&P 500 Index is an unmanaged index comprised of 500 widely held securities considered to be representative of the stock market in general. The S&P/Case-Shiller Home Price Indices measure the residential housing market, tracking changes in the value of the residential real estate market in 20 metropolitan regions across the United States. The Morgan Stanley EAFE Index represents 21 developed markets outside of North America. The MSCI Emerging Markets Index is a free float-adjusted market capitalization index that is designed to measure equity market performance in the global emerging markets. The Barclays U.S. Aggregate Bond Index is a market capitalization-weighted index of investment-grade, fixed-rate debt issues, including government, corporate, asset-backed, and mortgage-backed securities, with maturities of at least one year. The Barclays U.S. Corporate High Yield Index covers the USD-denominated, non-investment grade, fixed-rate, taxable corporate bond market. Securities are classified as high-yield if the middle rating of Moody’s, Fitch and S&P is Ba1/BB+/BB+ or below. The index may include emerging market debt. The Barclays Municipal Bond Index is an unmanaged index comprised of investment-grade, fixed-rate municipal securities representative of the tax-exempt bond market in general. The Barclays 1-3 Year Credit Index includes publicly issued U.S. corporate and specified foreign debentures and secured notes that are rated investment-grade (BBB- or higher) by at least two of the major ratings agencies, have maturities between one and three years, and have at least $250 million par amount outstanding. The Barclays 7-10 Year Credit Index includes publicly issued U.S. corporate and specified foreign debentures and secured notes that are rated investment-grade (BBB- or higher) by at least two of the major ratings agencies, have maturities between seven and ten years, and have at least $250 million par amount outstanding. The DJ-UBS Commodity Index Total ReturnSM measures the collateralized returns from a basket of 19 commodity futures contracts representing the energy, precious metals, industrial metals, grains, softs and livestock sectors. The Russell 1000 Index is a market capitalization-weighted benchmark index made up of the 1000 largest U.S. companies in the Russell 3000 Index (which comprises the 3000 largest U.S. companies). The Russell Midcap Index is a subset of the Russell 1000 Index. It includes approximately 800 of the smallest securities based on a combination of their market cap and current index membership. The Consumer Price Index (CPI) measures the change in the cost of a fixed basket of products and services. The Gross Domestic Product (GDP) rate is a measurement of the output of goods and services produced by labor and property located in the United States.