Commentaries
Economic and Market Overview: Second Quarter 2014
The following commentary summarizes prior financial market activity and uses data obtained from public sources. This commentary is provided to financial advisors and their clients as a resource for the management of assets and evaluation of investment portfolio performance. Download the full PDF
The Economy
 The domestic economic landscape in the second quarter remained mixed, after the effects of severe weather in the first quarter lingered. The Bureau of Labor Statistics lowered its third estimate of first quarter gross domestic product (GDP) to -2.9%, reflecting a broad-based contraction in many areas of the economy, including consumer spending, exports and business investment. It was the largest decline in GDP in five years. The employment situation continued its trend of modest improvement, with an average of about 200,000 jobs added each month during the quarter. In addition, payroll employment finally exceeded the pre-financial crisis peak, having recovered the 8.7 million jobs lost in the recession.
Globally, the themes remained similar to those that prevailed in the first quarter. The eurozone’s recovery continued to be tepid, prompting the European Central Bank (ECB) in June to take the aggressive step of lowering its deposit rate to -0.10%, which means financial institutions must pay interest on funds held at the central bank and not loaned out. The move was an effort to avoid the prospect of deflation, and marked the first time a central bank instituted a negative lending rate. Real GDP in the eurozone region increased a meager +0.2% on a quarter-over-quarter basis, but the year-over-year growth was a slightly better +0.9%.
In China, policymakers continue to walk the fine line between reining in credit while at the same time avoiding too deep of an economic slowdown. Annualized GDP growth in the first quarter (the latest data available) was +7.4%, the lowest in six quarters. At the same time, tight credit and soft demand resulted in the weakest quarterly property-investment growth since 2009. Premier Li Keqiang stated during the quarter that growth needs to exceed 7.5% in order to sustain employment, and analysts believe the government will institute additional stimulus measures should growth slow further.
During the second quarter the Federal Open Market Committee (FOMC) made few changes other than making further reductions in its asset purchase program. Analysts are now beginning to focus on what the FOMC plans to do with reinvestment proceeds of the securities on its balance sheet. The committee stated that it would continue to reinvest the proceeds, meaning that its balance sheet will not be reduced. Some economists have suggested that implementing a plan of not reinvesting the proceeds would essentially form a bridge to the next phase in the process, which would be an interest rate increase.
Highlights and Perspectives
Gross Domestic Product (GDP)
The Bureau of Economic Analysis released the third estimate of the first quarter 2014 real GDP, a seasonally adjusted annualized rate of -2.9%, down from the 2.6% annualized growth of the prior quarter, and a significant reduction from the prior estimate of a -1.0% decline. The contraction was primarily a result of slowing consumer spending on health care and reduced inventory accumulation. Analysts attribute some of the weakening on the severe winter weather, even though the effect was not quantified in the report. Corporate profits fell by 9.1% (not annualized), after having risen 2.2% in the prior quarter. While the GDP result was discouraging, economists generally believe that the lower inventory accumulation will eventually lead to an acceleration in growth down the road. Inflation remains relatively benign, with the personal consumption expenditures (PCE) index of prices gaining 1.4% during the quarter, up slightly from the 1.1% rate of the prior quarter. The consensus among economists is that the economy has strengthened significantly since the first quarter, with the improving employment situation being a solid indicator of the improvement. As a result, analysts expect GDP to accelerate to 3% later this year through 2015.
Housing
After somewhat of a pause in the first quarter, the housing segment once again proved to be a bright spot in the economy during the second quarter of 2014. Mortgage rates have come back down slightly after having risen late in 2013 and during the first quarter. In addition, credit requirements have loosened somewhat, as regulators attempt to increase credit availability through government-sponsored enterprises. Existing-home sales for May (the latest monthly data available) advanced at an annualized rate of 4.9 million units, the highest monthly percentage gain since August 2011. However, the pace of sales remains below the 5 million unit rate established in 2013. The inventory of existing homes is not as tight as it was last year, with 5.6 months of supply. Existing-home prices also continue to rise, but at a slowing rate, with the median price up 5.1% from a year ago. In the new-home segment, the NAHB Housing Market Index, a measure of homebuilding activity, ended the quarter at a level of 49, up modestly from the previous quarter’s reading of 46. June was the first month this year in which the index rose. Economists believe a continued rebound in housing is likely, primarily as a result of relatively constrained mortgage rates and the ongoing improvement in the employment situation.
Employment
As many analysts had expected, the employment situation followed up a resilient-but-lackluster first quarter with a solid performance during the second quarter of 2014. Employment growth was strong in April, as 288,000 jobs were added, likely a result of hiring being pushed from the first quarter into the second as a result of the harsh winter. The May payroll report, the latest available, showed a gain of 217,000 jobs, below April’s surge, but in-line with trendline growth. The trend of approximately 200,000 new jobs each month has enabled payroll employment to exceed the pre-recession peak set in 2008. The unemployment rate in May remained unchanged from April at 6.3% as a result of little change in the labor force participation rate. While total payrolls now exceed the pre-recession peak, the rate of new jobs added will need to accelerate going forward in order to keep pace with the growth in the working-age population. Analysts expect employment to pick up to about 300,000 jobs per month in 2015.
Fed Policy
The Federal Open Market Committee (FOMC), for the fifth consecutive meeting, decided to reduce its monthly asset purchases by $10 billion. The FOMC will now be buying $20 billion of Treasury securities and $15 billion of mortgage-backed securities, down from a total of $85 billion at the peak. In its announcement, the FOMC also lowered its estimate of the long-term fed funds rate from 4% to 3.75%, likely reflecting the economic contraction of the first quarter. As the FOMC’s asset purchase program winds down by the end of this year, attention is being paid to when the committee will refrain from reinvesting the principal payments from the debt it holds so that its balance sheet will be reduced. Fed-watchers believe that not reinvesting these payments will be the next logical step in the process prior to an increase in short-term interest rates.
Interest Rates
Fixed-income securities continued to defy many market analysts during the second quarter, following up the first quarter’s rebound with additional solid gains. Once again, the key driver of the generally higher prices was concern about the pace of economic growth. Also, as in the first quarter, geopolitical issues played a role. Whereas the tensions involving Russia and Ukraine created a flight-to-quality scenario in the first quarter, a flare-up involving Islamic factions in Iraq caused investors to err on the side of safety in the second quarter.
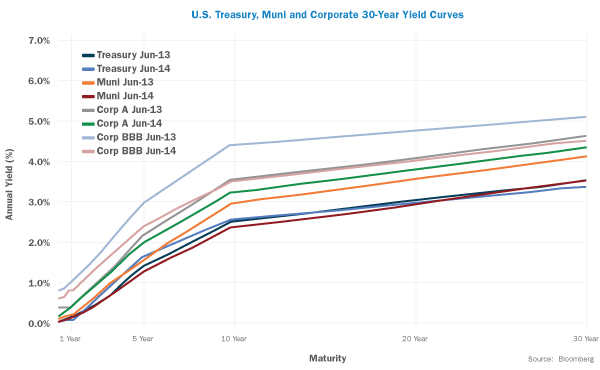
Within this environment, the shape of the yield curve remained relatively stable, as short-, intermediate- and long-term rates moved modestly lower in concert. During the quarter, performance was strong in January and February, as soft economic data, emerging economies’ difficulties and geopolitical tensions produced a flight to quality. By the end of the quarter, the yield on the benchmark 10-year U.S. Treasury had fallen to 2.52% from 2.72% on March 31st. Yields trended lower throughout the quarter, confounding a large portion of market analysts, who have been expecting higher interest rates since the Fed announced the winding down of its asset purchase program in 2013.
With a backdrop of uneven growth and mixed economic data, yields overall were generally lower across most of the yield curve. The yield on the 3-month T-bill remained steady at 0.02% at the end of the second quarter, down slightly from the previous quarter. Similarly, the yield on the five-year Treasury eased somewhat, ending the quarter at 1.63%, compared to 1.72% on March 31st, and as mentioned above, the yield on the 10-year Treasury declined to 2.52% from 2.72% over the same period. Inflation expectations continue to be contained, with the Fed’s gauge of five-year forward inflation expectations closing at 2.45% on June 30th, up slightly from 2.39% on March 31st.
Credit securities were also little impacted by the Fed’s decision to continue tapering its quantitative easing program and its slight modification of the long-term outlook for growth and interest rates. The yield on the Barclays 1-3 Year Credit Index was little changed, declining only two basis points to 0.97% from 0.99% during the quarter. Intermediate credit yields were also lower, with the yield on the Barclays 7-10 Year Credit Index falling to 3.41% on June 30th from 3.72% on March 31st. Similar to the situation in the first quarter, the positive environment for the equity market once again benefited high-yield securities. The yield on the Barclays U.S. Corporate High Yield Index declined to 5.72% from 6.10% at the end of the first quarter.
Municipal bonds posted a second consecutive strong quarter, as the fiscal situation of states and local governments continues to improve. As a result, municipal yields trended lower during the quarter, with the yield on the Barclays Municipal Bond index dropping to 2.36% at the end of the quarter from 2.71% as of March 31st.
In terms of total returns, fixed-income securities generated relatively robust results in the quarter, with government securities-related, credit and municipal indices all posting gains. The Barclays Treasury 5-7 Yr. Index advanced +1.8%, and the Barclays U.S. Corporate 5-10 Yr. Index gained +3.0% during the quarter. High yield securities also posted a solid return, booking a +2.4% advance. Municipals continued their recent good performance, as the Barclays Municipal Bond Index rose +2.6% for the quarter. International fixed income was also a strong performer during the past three months, with the Barclays Global Aggregate ex-U.S. Index advancing +2.7%.
Equities
 The second quarter was marked by extremely low equity market volatility, despite the uneven economic performance, tensions between Ukraine and Russia, flare-ups of violence in Iraq and other parts of the Middle East, and the ongoing reduction in asset purchases by the Fed. The Chicago Board Options Exchange SPX Volatility Index – better known as VIX – finished the quarter at 11.6, its lowest quarterly close since December 2006. When volatility is low, equities tend to trend higher, and that was the case in the second quarter. The S&P 500 delivered positive returns for each of the three months during the quarter, and has advanced in each of the past five months. For the quarter overall, the S&P 500 gained +5.2%, its sixth consecutive quarter of gains, the longest streak since 1998. The index has advanced +7.1% for the first six months of the year.
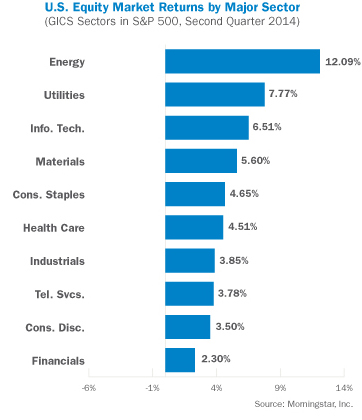
The performance dispersion among the ten primary economic sectors continues to suggest correlations across industries and stocks is declining after a long period of increasing. In such an environment stock selection takes on greater importance. The energy sector was the best performer in the second quarter, posting a gain of +12.1%, which was driven at least in part by geopolitical tensions in Ukraine and the Middle East. Utilities followed up strong first quarter performance with another solid gain of +7.8% in the second quarter; the interest rate-sensitive sector has advanced +18.7% for the first six months of the year. Each of the ten sectors generated positive returns during the quarter, with the poorest performer on a relative basis being financials, which advanced +2.3%.
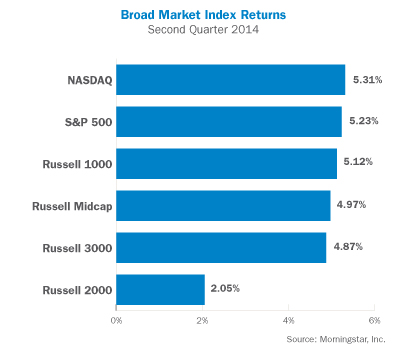
For the quarter, the Russell 1000 Index of large capitalization stocks generated a +5.1% total return. Within the large cap segment, value stocks again significantly outperformed growth stocks. Small capitalization stocks, as represented by the Russell 2000 Index, continued their weak performance relative to large caps, ending with a total return of +2.1%. However, there are signs that small caps may be regaining a leadership position, as performance in June was very strong. As in the large cap segment, value outperformed growth within the small cap universe. The Nasdaq Composite, dominated by information technology stocks, generated a return of +5.3% during the quarter. The Dow Jones Industrial Average of 30 large industrial companies gained +2.8% during the quarter, and is up a modest +2.7% on a year-to-date basis.
Real Estate Investment Trusts (REITs) again performed very well during the second quarter, as interest rates continued to defy expectations and trended lower. The DJ US Select REIT Index advanced +7.2% during the quarter, bringing its year-to-date gain to +18.2%. Commodities, on the other hand, experienced a more difficult time in the quarter, largely as a result of lackluster economic growth throughout the world. As a result, commodities were not able to deliver the same type of performance as in the first quarter, with the Bloomberg Commodity Index advancing a mere +0.1% for the quarter ended June 30th.
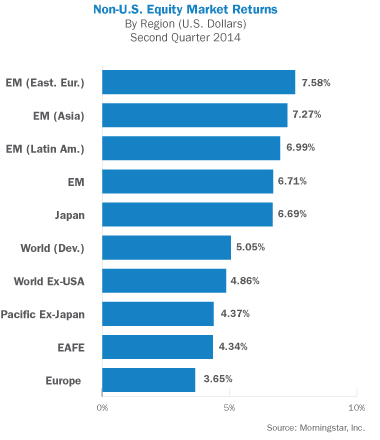 International stocks performed on par with U.S. equities in the second quarter. As the Fed has begun to tap the brakes on liquidity domestically, the European Central Bank has become more aggressive to ensure the eurozone region’s economies continue to recover. In addition, the lower interest rate environment has helped provide support to emerging economies, which swooned early in the year on the prospect of less liquidity and higher interest rates. Performance was generally solid throughout the world in the second quarter, with limited variation across countries and regions. The MSCI ACWI ex-USA Index, which measures performance of world markets outside the U.S., gained +5.3% in the second quarter, as both developed and emerging markets fared well. The MSCI EAFE Index of developed markets stocks gained +4.3% during the same period. Unlike recent prior quarters, regional performance was not particularly varied. Eastern Europe and Asia were the strongest relative performers, with the MSCI EM Eastern Europe and MSCI EM Asia indices posting gains of +7.6% and +7.3%, respectively. Latin America also generated strong returns, as the MSCI EM Latin America Index gained +7.0%. Emerging markets performance finally began to recover over the past three months, with greater clarity surrounding the winding down of asset purchases by the Fed. As a result, the MSCI Emerging Markets Index posted a gain of +6.7% for the quarter, its largest advance since the third quarter of 2012.
Outlook
The negative first quarter GDP data notwithstanding, the economy seems poised to accelerate in the coming months, according to many economists. Despite the frustratingly sluggish employment gains, payrolls now exceed the peak reached prior to the financial crisis in 2008, with the economy having replaced all of the 8.7 million jobs lost in the ensuing recession. Payroll gains are likely to accelerate as government employment increases now that government finances are more stable and fiscal austerity is winding down. Businesses are in a strong financial position to more aggressively hire, and may do so with less political infighting in Washington and greater clarity on the impact of healthcare reform. Potential risks to an improving economic and financial markets outlook include a faltering housing recovery, a monetary policy misstep, an inability of China’s policymakers to maintain growth while also removing excesses from their economy, and an escalation in geopolitical tensions.
Disclaimer
The information, analysis, and opinions expressed herein are for general and educational purposes only. Nothing contained in this quarterly review is intended to constitute legal, tax, accounting, securities, or investment advice, nor an opinion regarding the appropriateness of any investment, nor a solicitation of any type. All investments carry a certain risk, and there is no assurance that an investment will provide positive performance over any period of time. An investor may experience loss of principal. Investment decisions should always be made based on the investor’s specific financial needs and objectives, goals, time horizon, and risk tolerance. The asset classes and/or investment strategies described may not be suitable for all investors and investors should consult with an investment advisor to determine the appropriate investment strategy. Past performance is not indicative of future results.
Information obtained from third party sources are believed to be reliable but not guaranteed. Envestnet | PMC™ makes no representation regarding the accuracy or completeness of information provided herein. All opinions and views constitute our judgments as of the date of writing and are subject to change at any time without notice.
Investments in smaller companies carry greater risk than is customarily associated with larger companies for various reasons such as volatility of earnings and prospects, higher failure rates, and limited markets, product lines or financial resources. Investing overseas involves special risks, including the volatility of currency exchange rates and, in some cases, limited geographic focus, political and economic instability, and relatively illiquid markets. Income (bond) securities are subject to interest rate risk, which is the risk that debt securities in a portfolio will decline in value because of increases in market interest rates. Investing in commodities can be volatile and can suffer from periods of prolonged decline in value and may not be suitable for all investors. Index Performance is presented for illustrative purposes only and does not represent the performance of any specific investment product or portfolio. An investment cannot be made directly into an index.
Index Overview
The S&P 500 Index is an unmanaged index comprised of 500 widely held securities considered to be representative of the stock market in general. The S&P/Case-Shiller Home Price Indices measure the residential housing market, tracking changes in the value of the residential real estate market in 20 metropolitan regions across the United States. The Morgan Stanley EAFE Index represents 21 developed markets outside of North America. The MSCI Emerging Markets Index is a free float-adjusted market capitalization index that is designed to measure equity market performance in the global emerging markets. The Barclays U.S. Aggregate Bond Index is a market capitalization-weighted index of investment-grade, fixed-rate debt issues, including government, corporate, asset-backed, and mortgage-backed securities, with maturities of at least one year. The Barclays U.S. Corporate High Yield Index covers the USD-denominated, non-investment grade, fixed-rate, taxable corporate bond market. Securities are classified as high-yield if the middle rating of Moody’s, Fitch and S&P is Ba1/BB+/BB+ or below. The index may include emerging market debt. The Barclays Municipal Bond Index is an unmanaged index comprised of investment-grade, fixed-rate municipal securities representative of the tax-exempt bond market in general. The Barclays 1-3 Year Credit Index includes publicly issued U.S. corporate and specified foreign debentures and secured notes that are rated investment-grade (BBB- or higher) by at least two of the major ratings agencies, have maturities between one and three years, and have at least $250 million par amount outstanding. The Barclays 7-10 Year Credit Index includes publicly issued U.S. corporate and specified foreign debentures and secured notes that are rated investment-grade (BBB- or higher) by at least two of the major ratings agencies, have maturities between seven and ten years, and have at least $250 million par amount outstanding. The DJ-UBS Commodity Index Total ReturnSM measures the collateralized returns from a basket of 19 commodity futures contracts representing the energy, precious metals, industrial metals, grains, softs and livestock sectors. The Russell 1000 Index is a market capitalization-weighted benchmark index made up of the 1000 largest U.S. companies in the Russell 3000 Index (which comprises the 3000 largest U.S. companies). The Russell Midcap Index is a subset of the Russell 1000 Index. It includes approximately 800 of the smallest securities based on a combination of their market cap and current index membership. The Consumer Price Index (CPI) measures the change in the cost of a fixed basket of products and services. The Gross Domestic Product (GDP) rate is a measurement of the output of goods and services produced by labor and property located in the United States.
© 2014 Envestnet | PMC. All rights reserved