Commentaries
PMC Weekly Review - September 3, 2019
Hoping for the Best, Preparing for the Worst
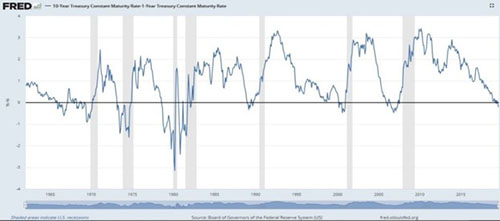
The latest economic news may be causing an unsettling tinge of trepidation for investors, which is certainly understandable. The most ominous sign is the Treasury yield curve inversion. The figure below illustrates that prior to the most current yield curve inversion1, it has inverted eight times since January 1962, and seven of those inversions were followed shortly by a recession. Not to raise an alarm, but that is a .875 batting average! The Federal Reserve’s (the Fed) federal funds rate cut2 on July 31 may be the most immediate cause of this inversion, t accompanied by a less-than-enthusiastic economic outlook. The Fed’s purported concern, of course, is the drastically slowing growth in Gross Domestic Product (GDP), which clocked in at 2.10% for Q22019. This figure was much lower than the first quarter’s 3.10% rate, and below the three-year average of 2.30%. In addition, the Core PCE reading (the Fed’s favored inflation measure) was 1.60% in July, significantly below its presumed 2% target.
We have highlighted the most negative items in the latest economic scorecard, and it may be that all of this will pass. So, why are we riling up investors? Because it pays to be prepared in case the worst does strike. Thus, we offer advice on how investors can position their equity portfolio from a risk-factor perspective. In another words, we analyze the risk-adjusted performance (based on the most well-known and widely accepted risk factors3 in the finance community) through various stages of the market from July 1963 to now, and then draw conclusions from this analysis.
Seven complete business cycles (i.e., an expansion followed by a recession) have occurred since July 1963, using NBER’s classification, and we are in the midst, or perhaps the tail end, of the expansion phase of the eighth business cycle— the longest one on record thus far.4 Adding color to our analysis, we have further divided the expansion phase into early expansion (EE), midexpansion (ME), and late expansion (LE).5
How have the various risk factors performed throughout each stage of the business cycle? And, of more immediate concern, given the likely location of the current US economy on the arc of the business cycle, which factors perform best during a recession? The following table provides the answers.6
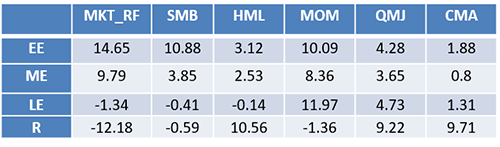
The table illustrates that these three risk factors shine during recessions:7 Value (HML), Quality (QMJ), and Payout (CMA). Finance principles suggest this makes sense on an intuitive basis: Firms whose fundamentals reflect fair value, have solid accounting measures, and pass the lion’s share of their profits to shareholders, rather than using those profits to invest in ever-expanding projects that run the risk of extending those companies financially, should prevail when a recession rolls around. Also, correlations between MKT and QMJ/CMA are more negatively pronounced during recessions, so emphasizing these factors at that time also can help to reduce a portfolio’s volatility.
In summary, investors should position their equity portfolio to combat the turbulence of recession by overweighting Value, Quality, and Payout/Dividend factors. This will help both to elevate the expected return of the portfolio and to subdue its volatility.8
Janis Zvingelis
Director of Quantitative Research
Footnotes
1We use the difference between 10- and 1-year constant maturity Treasury yields, because these maturities have the longest data histories readily accessible from the St. Louis Fed’s FRED database. Other researchers advocate looking at 10- and 2-year, 10-year and 3-month, or even some other maturity bond yield differences, but the direction, if not the magnitude of these indicators, is essentially the same.
2Also the “dot plots”—the forecasts from the members of the FOMC (the group of people who vote on the direction of the federal funds rate)—show a drastic shift, from a median of about 2.75% for years 2020 and 2021 during their March 20 meeting (https://www.federalreserve.gov/monetarypolicy/files/fomcprojtabl20190320.pdf) to about a median 2.25% for the same period during their June 19 meeting. The market is signaling that even 2.25% might be wildly optimistic ((https://www.cmegroup.com/trading/interest-rates/countdown-to-fomc.html/).
3These are: Market factor (MKT), Size factor (SMB), Value factor (HML), Momentum factor (MOM), Quality factor (QMJ), and Investment/Payout factor (CMA). All of these factors are well known in the financial industry, but we note that the CMA factor is closely related to AQR’s Payout factor, which attempts to measure the fraction of profits paid out to shareholders. We use data from Fama-French and AQR’s data libraries.
4The average/median length of each expansion period is 79/84 months, whereas the average or median length of each recession is 11 to12 months. As of August 2019, the current expansion is 124 months and counting.
5Somewhat arbitrarily, we assign length of ¼ of the overall expansion phase to EE and LE sub-periods, while allocating ½ to ME.
6The returns are presented in annualized percentage terms.
7Incidentally, note the poor performance of Value (HML) in the late-expansion stage, which mirrors the current struggles of HML and smart-beta strategies in general.
8For the sake of brevity, we have not included these results, but they will be available, along with other more detailed analysis, in a forthcoming QRG whitepaper.
The information, analysis, and opinions expressed herein are for general and educational purposes only. Nothing contained in this weekly review is intended to constitute legal, tax, accounting, securities, or investment advice, nor an opinion regarding the appropriateness of any investment, nor a solicitation of any type. All investments carry a certain risk, and there is no assurance that an investment will provide positive performance over any period of time. An investor may experience loss of principal. Investment decisions should always be made based on the investor’s specific financial needs and objectives, goals, time horizon, and risk tolerance. The asset classes and/or investment strategies described may not be suitable for all investors and investors should consult with an investment advisor to determine the appropriate investment strategy. Past performance is not indicative of future results. Information obtained from third party sources are believed to be reliable but not guaranteed. Envestnet|PMC™ makes no representation regarding the accuracy or completeness of information provided herein. All opinions and views constitute our judgments as of the date of writing and are subject to change at any time without notice. Investments in smaller companies carry greater risk than is customarily associated with larger companies for various reasons such as volatility of earnings and prospects, higher failure rates, and limited markets, product lines or financial resources. Investing overseas involves special risks, including the volatility of currency exchange rates and, in some cases, limited geographic focus, political and economic instability, and relatively illiquid markets. Income (bond) securities are subject to interest rate risk, which is the risk that debt securities in a portfolio will decline in value because of increases in market interest rates. Exchange Traded Funds (ETFs) are subject to risks similar to those of stocks, such as market risk. Investing in ETFs may bear indirect fees and expenses charged by ETFs in addition to its direct fees and expenses, as well as indirectly bearing the principal risks of those ETFs. ETFs may trade at a discount to their net asset value and are subject to the market fluctuations of their underlying investments. Investing in commodities can be volatile and can suffer from periods of prolonged decline in value and may not be suitable for all investors. Index Performance is presented for illustrative purposes only and does not represent the performance of any specific investment product or portfolio. An investment cannot be made directly into an index. Alternative Investments may have complex terms and features that are not easily understood and are not suitable for all investors. You should conduct your own due diligence to ensure you understand the features of the product before investing. Alternative investment strategies may employ a variety of hedging techniques and non-traditional instruments such as inverse and leveraged products. Certain hedging techniques include matched combinations that neutralize or offset individual risks such as merger arbitrage, long/short equity, convertible bond arbitrage and fixed-income arbitrage. Leveraged products are those that employ financial derivatives and debt to try to achieve a multiple (for example two or three times) of the return or inverse return of a stated index or benchmark over the course of a single day. Inverse products utilize short selling, derivatives trading, and other leveraged investment techniques, such as futures trading to achieve their objectives, mainly to track the inverse of their benchmarks. As with all investments, there is no assurance that any investment strategies will achieve their objectives or protect against losses. Neither Envestnet, Envestnet|PMC™ nor its representatives render tax, accounting or legal advice. Any tax statements contained herein are not intended or written to be used, and cannot be used, for the purpose of avoiding U.S. federal, state, or local tax penalties. Taxpayers should always seek advice based on their own particular circumstances from an independent tax advisor. © 2019 Envestnet. All rights reserved.